


| Story Views | |
| Now: | |
| Last Hour: | |
| Last 24 Hours: | |
| Total: | |
Claude Resources (CGR) and Gold’s Parabola+

I’ve got to admit that I’m really liking what I am seeing now as gold is in free fall and trading just above $1563. It’s been fully 15 months since gold’s last annual cycle low (long overdue) and the price action now promises to bring the 2013 annual cycle low in a matter of days, if that. Additionally, gold’s weekly cycle is on week 20 and that is due to bottom (average is 20-24 weeks). And the daily cycle is running long and on day 28 (average 24 days).
It doesn’t get much better than this. The rallies out of annual cycle bottoms are worth the price of admission to the beholder, even better if one is LONG for the ride.
But what a wait it has been to get to this day! So, so true.
Anyway, this post will take a quick look at Claude Resources Inc (CGR) which very recently posted its 2012 results and provided a substantial amount of very favorable information in their conference call last Thursday March 28, 2013.
You can read the entire transcript at:
http://seekingalpha.com/article/1307741-claude-resources-ceo-discusses-q4-2012-results-earnings-call-transcript?source=yahoo
Following our fascinating look at a couple of CGR charts, we’ll look at a monthly chart of gold futures and cast a new spot light on the math of a parabola as it takes shape and prepares for hitting the stars.
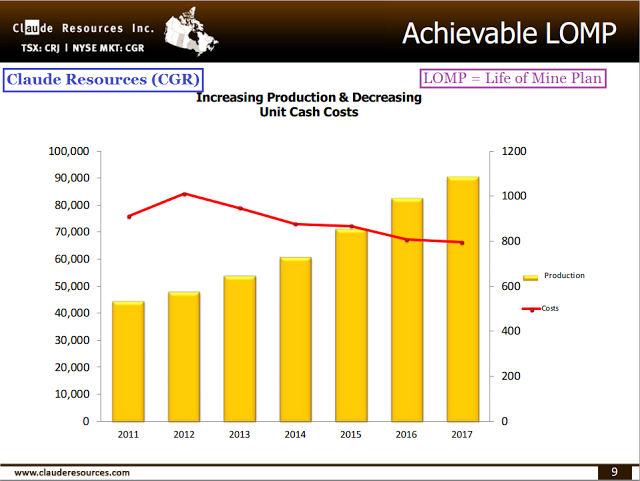
This first chart comes from Claude Resources’ website:
www.ClaudeResources.com
 |
| Click on any chart to ENLARGE |
The conference call transcript provides a good amount of color and makes the information on this chart easier to grasp. But the short of it is this: management is confident that the annual ounces of gold production will increase from something in the neighborhood of 45,000 in 2012 to nearly 100,000 within the next 5 years (2017). AND, the cost to produce each ounce is expected to fall from $1,000 to $800.
I kinda think a company that can double its mining output and cut costs of production at the same time might make some money, no?
Of course, I do encourage you to do research before buying this or any stock with the conviction of your hard-earned dollars. The links above will give you a solid starting point on Claude Resources Inc. (CGR), should you be interested. Also, I have written about this stock recently.
So what does the weekly stock chart of CGR look like now?
Well, it looks insanely stupid cheap considering the earnings (past and projected), and considering the stock price per share in relation to the tangible book value of each share (selling at 37% of book value).
But some other technical details on this weekly chart find me smiling from ear to ear.
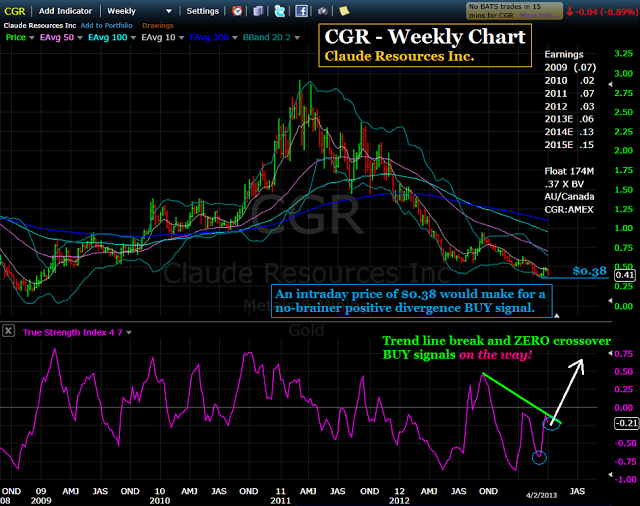
This is (finally) a great setup. Some sharp movement lower and then a reversal will catapult this thing like a kid on a trampoline. The TSI (7,4) is nearly up to ZERO, yet price is pennies from a new low. Circled in light blue is the perfect setup for a powerful positive divergence BUY signal. Should price trade intraday to or below $0.38, that would make the signal official.
But, there’s more! The green TSI trend line shows that once the purple TSI indicator crosses up through it, the trend line break BUY signal will be activated. And thirdly, at -0.21, the TSI is not going to need much help to give a ZERO crossover BUY signal once price starts to pop. This signal is given once the indicator transitions from negative to positive readings.
I love these ‘the gun’s loaded’ setups because when you get three TSI BUY signals quite literally at once, well, the odds for success are very very good.
Yes, this is a weekly chart and yes, all three BUY signals may not be fully triggered for a week or two…but you get my point, I’m sure. Unless you are a dare-devil (like me) you would be prudent to wait for at least two of these BUY signals to be active before jumping in, if so inclined.
For nearly two weeks now I have had a limit order to buy CGR at just below $0.40. With a little luck I may get what I will consider, until proven otherwise, the best deal of any trade I’ve ever done.
And finally, let’s take a look at gold’s monthly chart from 2000 to the present and let the computer do a little calculating for us.
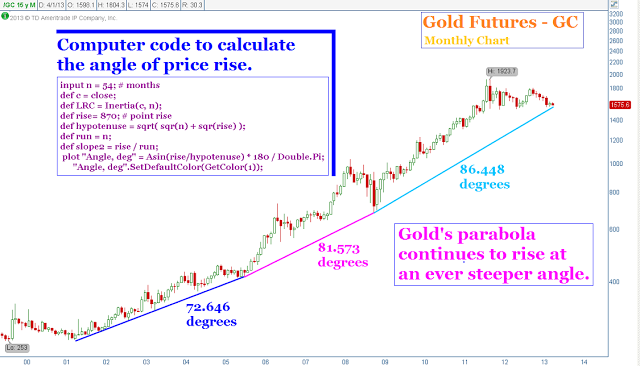
I drew a straight line (blue) connecting the slope of the monthly candles beginning in around February 2001 to a point where it seemed that price took on a new and steeper slope. I repeated the process (magenta) which took me to the 2008 8-year cycle low. Then I completed the exercise (cyan) to bring us to this month’s candle.
One expects a parabola to continue to rise at ever steeper angles. So, for the fun of it, I used some computer code (ThinkScript) to calculate the angle of the three differently colored slopes. And to no surprise, gold’s parabola is indeed behaving (mathematically) just like a parabola is supposed to behave. Initially rising at 72.6 degrees, the second phase was rising above horizontal at 81.5 degrees and the third phase was steeper yet at 86.4 degrees.
Price can be charted with and without the use of log scale and that will make the slope of price ‘look’ different. Even I am shaking my head at the notion that gold’s third leg is rising at 86+ degrees. But if I were to have compressed the candles instead of shown them lolly-dollying across the screen, I could have made the price trajectory ‘look’ like 86+ degrees. Anyway, I have always enjoyed math because it gives you an answer that is definite and true….so, I guess it’s 86 degrees for now and the next leg will be even steeper as we await the 90 degree vertical conclusion in years to come.
Well, I hope you are enjoying this conclusion to the boring waiting as much as I am. I can’t wait to see what tomorrow will bring!
Keep in touch,
John
[email protected]
2013-04-02 20:48:30
Source: http://thetsitrader.blogspot.com/2013/04/claude-resources-cgr-and-golds-parabola.html
Source:
