


| Story Views | |
| Now: | |
| Last Hour: | |
| Last 24 Hours: | |
| Total: | |
Here’s What Happens After a Huge Rally [3 Must-See Charts]

This post Here’s What Happens After a Huge Rally [3 Must-See Charts] appeared first on Daily Reckoning.
What goes up will probably keep going up.
It’s a bit of a twist on the old Isaac Newton quote, I know.
But the fact of the matter is that, gravity excluded, what goes up often doesn’t come back down. At least when it comes to the financial markets, that is.
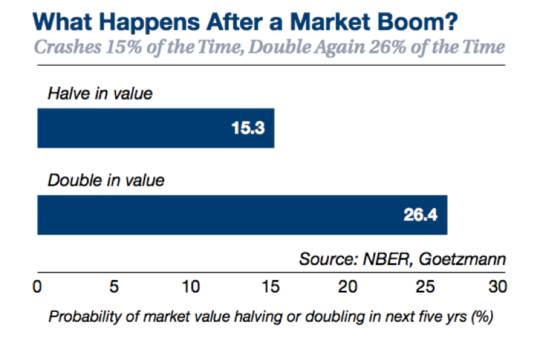
Last year, the National Bureau of Economic Research published a paper by Yale Professor William Goetzmann. In it, he showed that booms are rarely followed by busts. His study of 42 different stock markets from 1900 to 2014 found that booms are more likely to be followed by more booms.
In fact, a stock market that’s doubled in the past year is almost twice as likely to double again as it is to get cut in half in the year that follows.
Think about that for a second. It completely flies in the face of common investing wisdom.
“More importantly, it flies in the face of market psychology,” my trading colleague Jonas Elmerraji notes. “If you picked ten investors off the street, and asked them whether they’d be willing to buy a stock after it had just doubled, most would think you were nuts for even asking the question. But as the data show, markets are far more likely to hand you another 100% gain than they are to hurt you.”
In other words, what goes up will probably keep on going up.
As a Rude Awakening reader, you already know that markets trend.
In fact, just last week, I showed you why trend following is the secret to the S&P 500’s serial outperformance over the long-run.
All markets, everywhere, anytime humans are in control of supply and demand, will exhibit trends. And trend following is the strategy that can put you in position to take advantage of that.
Even better, trend following can help you walk away with big profits in the less common situations when what goes up does indeed come back down.
To show you what I mean, let’s go back to the guy who penned the original quote gravity quote I tweaked earlier: Sir Isaac Newton.
Trend Following in the 1700s
As it turns out, Newton was an active investor, although not a good one. And he ended up losing much of his fortune in one of the most notorious market bubbles of all time – the South Sea Bubble.
“Back in the early 1700s, the South Sea Company had a monopoly on trade with the Spanish colonies in South America, a concession they’d earned by basically assuming the British government’s debt from the War of Spanish Succession,” Jonas says. “To raise money, they turned to the stock market, where they issued stock to investors eager to share in the riches from the South Seas.”
The only problem was that the riches weren’t quite as vast as the South Sea Company’s marketing made it seem. Shares exploded higher in the winter of 1720, Jonas notes, only to collapse by that fall.
And Isaac Newton got caught in the selloff after finally deciding to take a big position near the top. While he’d taken some tidy profits that spring on an earlier position, the money being made by Newton’s friends and family was too hard to watch. By the time he got back in, it was too late.
This chart of Newton’s poor trade timing has become a storied piece of investing lore:

And modern investing publications frequently use it to show the dangers of bubbles.
“The problem is that Newton’s South Sea chart isn’t a cautionary tale for the reasons that most people think,” Jonas explains. “In fact, it shows a big missed opportunity on a huge trend.”
Newton’s mistake wasn’t that he bought when he did. His mistake was that he invested using emotion, and he failed to use a stop loss.
“Looking at the South Sea chart, Newton really didn’t buy at the top,” Jonas concludes. “The South Sea Company continued to rally for months after his “ill-timed” buy. And it could have actually been a profitable investment had he followed the price action and sold when South Sea rolled over.”
Let’s imagine for a second that Isaac Newton was a rudimentary trend follower. Here’s the chart they don’t show you — what the South Sea Company’s stock price chart looks like with a very simple trend indicator, the 50-day moving average, overlaid on top of it:

“Simply by selling his South Sea Company stock when the uptrend broke – when the price slid below the 50-day moving average – Newton could have walked away incredibly wealthy from one of the most famous boom-and-bust bubbles in history,” Jonas concludes.
What Newton did wasn’t uncommon.
It’s human nature to buy high and sell low – we’re practically programmed to do it. And that’s precisely why it’s so critical to use trend following tools in your portfolio. Systems can’t succumb to human nature.
There are two very important pieces of unconventional intel that I wanted to make sure you take away here…
First, markets that have gone up a lot are far more likely to keep on going up than they are to reverse.
And second, even the ones that do eventually go bust can be traded profitably simply by sticking to a trend following approach.
These two nuggets are very important because they fly in the face of everything most investors think they know about the stock market.
And they’re backed by hard data.
Stay tuned – I’m going to show you how hard data totally busts another commonly-held investing “truism” soon.
Sincerely,
Greg Guenthner
for The Daily Reckoning
The post Here’s What Happens After a Huge Rally [3 Must-See Charts] appeared first on Daily Reckoning.
This story originally appeared in the Daily Reckoning
Source: https://dailyreckoning.com/heres-what-happens-after-a-huge-rally-3-must-see-charts/
