
| Online: | |
| Visits: | |
| Stories: |

| Story Views | |
| Now: | |
| Last Hour: | |
| Last 24 Hours: | |
| Total: | |
“The Growing Divide Between The Haves and The Have-nots, In One Stunning Chart”
Sunday, April 9, 2017 3:33
% of readers think this story is Fact. Add your two cents.
“The Growing Divide Between The Haves and The Have-nots,
In One Stunning Chart”
by Shawn Langlois
“The 1% tend to sweep it under their elegant Persian rugs, while those struggling to make rent scream it from the unemployment line: Inequality in the United States is bad and it’s only getting worse. To further the discussion, the Center for Economic and Policy Research, a Washington, D.C.-based think tank, this week shared research from a trio of contributors, led by French economist Thomas Piketty, in an attempt “to create inequality statistics for the U.S. that overcome the limitations of existing data.”
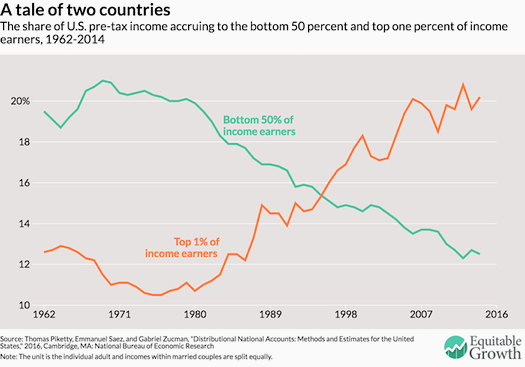
This chart, originally published in December on the Washington Center for Equitable Growth website, caught some refreshed social-media buzz:
“It’s a tale of two countries,” the authors wrote. “For the 117 million U.S. adults in the bottom half of the income distribution, growth has been nonexistent for a generation, while at the top of the ladder it has been extraordinarily strong.”
And it’s not due to the aging population. Rather, income has actually dropped for the working class. In fact, none of the growth from 1980 to 2014 went to the bottom 50%, the study pointed out. Only 32% went to the middle class, while the top 10% reaped 68% of the growth. A full 36% went to the 1% alone. Troubling? “An economy that fails to deliver growth for half of its people for an entire generation is bound to generate discontent with the status quo and a rejection of establishment politics,” the authors said.
University of Michigan economist Justin Wolfers, who helped make the chart a hot topic on Twitte, had this say when he saw the illustration: “Just think how amazing it is that both of these lines even fit on the same chart with the same axes.”
◆
Related:
“Income Share for the Bottom 50% of Americans is ‘Collapsing,’”
Source: http://coyoteprime-runningcauseicantfly.blogspot.com/2017/04/the-growing-divide-between-haves-and.html


