


| Story Views | |
| Now: | |
| Last Hour: | |
| Last 24 Hours: | |
| Total: | |
Global Tropical Cyclone Landfalls 2012

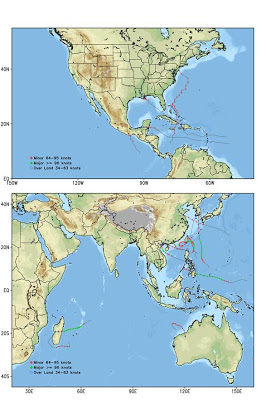
Earlier this year, Jessica Weinkle, Ryan Maue and I published a paper in the Journal of Climate on trends in global landfalling hurricanes (a PDF can be found here as well). At the global level the data is good from 1970. Our analysis covered through 2010. With 2012 almost in the books I recently asked Ryan if he could provide an initial tabulation of the 2012 data (note that the data could be revised from these initial estimates, and 2012 is still not quite over). The tracks of the fourteen landfalling storms of 2012 can be seen in the graphic at the top of this post.
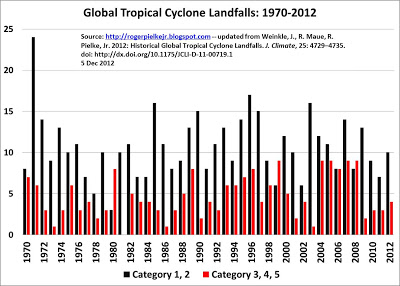
Below is the dataset from 1970 first presented in our paper, updated with 2011 and 2012 included. In short, 2012 is just about an average year with 14 total landfalls (15.4 is average) of which 4 (initially, but could change, 4.6 is the average) characterized as major.
Here are some updated factoids summarized from the data:
- Over 1970 to 2012 the globe averaged about 15 TC landfalls per year (Category 1-5)
- Of those 15, about 5 are intense (Category 3, 4 or 5)
- 1971 had the most global landfalls with 30, far exceeding the second place, 25 in 1996
- 1978 had the fewest with 7
- 2011 tied for second place for the fewest global landfalls with 10 (and 3 were intense, tying 1973, 1981 and 2002)
- Five years share the most intense TC landfalls with 9, most recently 2008.
- 1981 had the fewest intense TC landfalls with zero
- The US is currently in the midst of the longest streak ever recorded without an intense hurricane landfall
- The past 4 years have seen 12 major landfalling hurricanes, very low but not unprecedented — 1984-1987 had just 11. The most is 35 (2005-2008).
- The past 4 years have seen 51 total landfalling hurricanes, on the low end — the least is 41 (1978-1981) and the most is 80 (four periods, most recently 2004-2007).
- There have been frequent four-year periods with more than 25 landfalling major hurricanes, or more than a 100% increase of what has been observed over the past 4 years.
Anyone who’d like to argue that the world is experiencing a “new normal” with respect to tropical cyclones is simply mistaken. Over the past 4 years, the world is actually in the midst of a very low period in tropical cyclone landfalls — at least as measured over the past 43 years.
There is even evidence in our paper (see our Figure 2) that the period before 1970 saw more intense hurricane landfalls than the period since. Older data from the North Atlantic and Western North Pacific (which together represents 64% of all global intense landfalling hurricanes 1970-2010 and 69% of all hurricanes) indicates that landfalling intense hurricanes in these two basins occurred at a 40% higher rate from 1950-1969 than 1970-2010. There were 9 intense landfalls in 1964 and 1965 in just these two basins, which equals the global record for all basins post-1970.
What we can glean from this data is that in terms of US and global damage, things will get much worse when the statistics return to the “old normal” (and this is independent of whether you think such a return is due to natural variability, human-caused climate change or the prophesies of Nostradamus). It will happen — and you can take that to the bank.
For those interested in the details, here from Ryan are the preliminary details for 2012 to date:
** with the appropriate caveats about operational TC tracks subject to revision, which is expected in the post-season analyses.My list of 2012 storms includes a total of 14 Hurricane Strength Landfalls of which 4 were major.Western Pacific: 8 total Typhoon landfalls of which 3 were Major(+)+Vicente (09W)Saola (10W)Damrey (11W)Kai-Tak (14W)+Tembin (15W)Sanba (17W)Son-Tinh (24W)+Bopha (26W)Eastern Pacific: 1 minor hurricane landfallCarlotta (03E)North Atlantic: 3 minor hurricane landfalls:Ernesto (05L)Isaac (09L)Sandy (18L)** Sandy was rapidly deepening prior to landfall in Cuba at 95 knots, 1-knot below major threshold. Thus, strong possibility it could be upgraded in final best-tracks.Southern Indian Ocean: 1 major and 1 minor Cyclone landfallGiovanna (12S) — major over MadagascarLua (17S) — minor over Australia, was 95 knots, so could be an upgrade.
Lots more great data and graphs, including the one below on total global tropical cyclone activity (not just those that make landfall) at his website here.

2012-12-06 06:40:22
Source: http://rogerpielkejr.blogspot.com/2012/12/global-tropical-cyclone-landfalls-2012.html
Source:
