
| Visitors Now: | |
| Total Visits: | |
| Total Stories: |

| Story Views | |
| Now: | |
| Last Hour: | |
| Last 24 Hours: | |
| Total: | |
Why The Massacre In Silver Isn’t Over Yet
Tom McClellan – McClellan Market Report

It is a standard principle of science that experiments should be repeatable. The rules of physics should operate the same way everywhere. So if you drop a brand new tennis ball in New York, it should bounce the same way that a brand new tennis ball bounces in Melbourne. The rules of market physics are a lot different and often more variable than the rules for the physical world, but the presumption behind chart pattern analogs is that if you are seeing the same behavior, then the same sorts of inputs and rules of motion are at work.
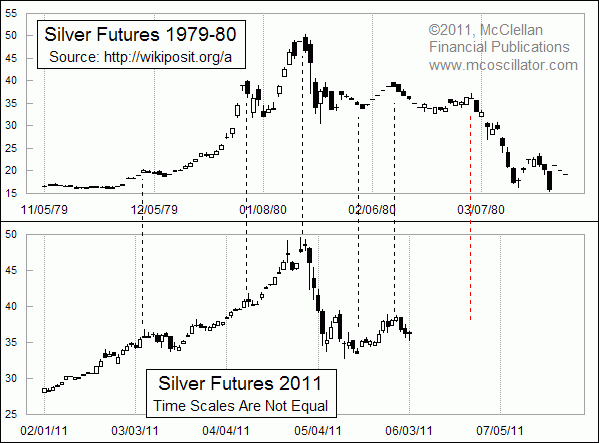
This week’s chart takes a look back at the silver bubble of 1980. That famous episode resulted from an attempt by brothers William Herbert Hunt and Nelson Bunker Hunt to corner the silver market. Prior to the run up, silver prices had been trading in the high single digits, then jumped up to between $15 and $20 before starting a parabolic move to $50. At the point when silver hit $50/oz, the CFTC and the Chicago Mercantile Exchange intervened with restrictions on position sizes and higher margin requirements. That effort broke the Hunt’s corner play, forcing traders to sell to meet margin calls. The initial decline took silver futures down from an intraday high of $50.36 to a low $30.25 in just 3 days, and to a more solid intraday low of $33.10 6 trading days after the top. Just 2 months later, silver was back down below $20.
I have not read it yet, but my friend Ian McAvity recommends the book Beyond Greed by Stephen Fay for insights on that whole 1980 silver bubble episode. Ian has been writing the newsletter Deliberations since shortly after the earth’s crust cooled, and he is a well known expert on the precious metals markets.
I thought it would be interesting to see how the silver top of 2011 might compare to that 1980 episode. One big point of similarity between the two events has been the efforts of the CME Group (successor to the Chicago Mercantile Exchange) to raise margin requirements for futures traders in order to curtail excessive speculation. And the $50/oz level appears to have been the price that the CME group wanted to defend, just as in the 1980 episode. Like the 1980 example, silver’s first stop on the way down from $50 was an intraday low at $33.54 just 6 trading days after the top.
The key point of difference between the two periods in this comparison is that I had to bend time a little bit in order to align the other chart structures. The patterns look the same, but the current silver market is taking about 20% longer to trace out the same dance steps. The vertical grid lines in each chart are spaced 21 trading days apart (1 month), but the horizontal spacing of those lines is different in the two charts.
Why the current structure is taking 20% longer to make the same moves is an interesting question, but for as long as the price patterns continue to correlate we don’t really need to find a precise answer. It may be that changes since 1980 in what I like to call the “viscosity of money” are responsible for this change in the rate of price pattern progression, just as the action of a water filled wave pool would be different from one filled with some other fluid.
Lookingahead, if the current silver market keeps following the pattern made by silver prices in 1980, then we should look for a resumption of the decline starting in late June.


