


| Story Views | |
| Now: | |
| Last Hour: | |
| Last 24 Hours: | |
| Total: | |
7.8% unemployment was predicted in April 2012

u(t) = p(t-2) + 2.5dLF(t-5)/dtLF(t-5) + 0.0585 (1)
where inflation (CPI) leads unemployment by 2 years and the change in labor force by 5 years. We have already postedon the performance of this model several times.
Here a model with monthly estimates of CPI, u, and labor force is presented. The time lags are the same as in (1) but coefficients are different since we use month to month a year ago rates of growth. We have also allowed for changing inflation coefficient. The best fit models for the period after 1978 are as follows:
u(t) = 0.63p(t-2) + 2.0dLF(t-5)/dtLF(t-5) + 0.07; between 1978 and 2003
u(t) = 0.90p(t-2) + 4.0dLF(t-5)/dtLF(t-5) + 0.30; after 2003
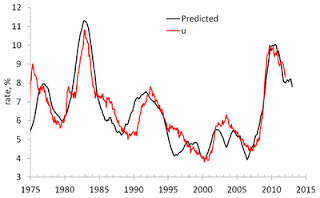
There is a structural break in 2003 which is needed to fit the predictions and observations in Figure 1. Due to strong fluctuations in monthly estimates of labor force and CPI we smoothed the predicted curve with MA(24). The rate of unemployment became more sensitive to the change of inflation and labor force. Alternatively, definitions of all three (or two) variables were revised around 2003, which is the year when new population controls were introduced by the BLS.
All in all, the monthly model predicts the observed rate of unemployment which has recently dropped to 8.3%. We expect the rate to fall further to the level of 7.8% by the end of 2012.
Figure 1. Observed and predicted rate of unemployment in the USA.
2012-10-05 23:08:22
Source: http://mechonomic.blogspot.com/2012/10/78-unemployment-was-predicted-in-april.html
Source:
