


| Visitors Now: | |
| Total Visits: | |
| Total Stories: |

| Story Views | |
| Now: | |
| Last Hour: | |
| Last 24 Hours: | |
| Total: | |
All But Obliterated

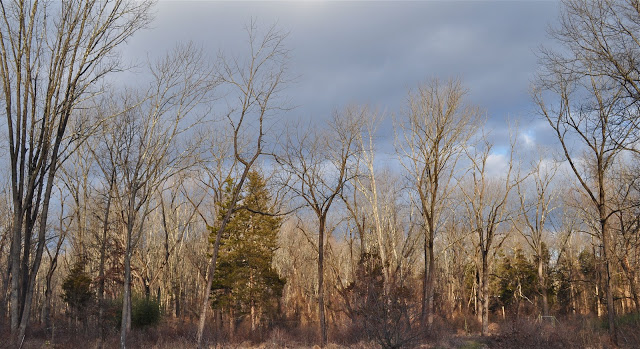
It’s been hideous outside – grey and brown, dark and cold. It is so ugly, it makes it harder to quell the fear of a morbid world, where tornados appear without warning in places they shouldn’t, and reports pile on of species going extinct, whooping cranes, ducks and butterflies. The sun broke through for about 45 seconds yesterday afternoon, so I ran out to take some quick pictures of the lichen forest, silently expiring behind Wit’s End. For the most part though, I’ve huddled inside, poring over hundreds of pages from Forest Service reports…which we’ll get to eventually. This Boston Globe article - about the impossible task to locate trees suited to survive in urban areas – contains a number of misconceptions:


“Not the tree that we thought it was”? Perhaps the tree isn’t growing in the air they thought it was! Fifteen to seventy years is infancy for most trees. Pears aren’t just “susceptible to damage from winter storms”. That might cause heavily-laden branches to snap, but it can’t account for their bark cracking and splitting, which is pretty much a universal symptom of devastating physiological damage from absorbing poisonous chemicals and gases. Trees are dying early, because the atmosphere and rain are acid. But it is nigh impossible to get those who are best situated to know to admit that.


Before we get to those voluminous Forest Service reports though, here’s a link to a wonderful website called Environmental History Resources, which is maintained by a professor who, I think, is Dutch. Among other essays, he wrote one called “The Role of Wood in World History”. It surprised me to learn, although it shouldn’t have, that civilizations have over and again relied upon and then ruthlessly depleted their supply of forests, being then forced forage elsewhere, conquering other societies to import their supplies, or collapsed. I have always regarded forests as essential for all they provide – fruit and nuts, wildlife habitat, and most of all for their primeval beauty. But in this broader perspective, their foundational role as a prerequisite for civilization to grow and prosper is made apparent:


“Today it is hard to believe that in antiquity vast forests were growing in the Middle East. However, during the early part of the third millennium BCE, the mountain slopes of this region were covered with massive cedar forests. These forests disappeared in the millennia before Christ’s birth about two thousand years ago. The destruction of the cedar forests of the Middle East is told in the oldest known, surviving written story in the world: The epic of Gilgamesh. The epic was written in Mesopotamia sometime during in the 3rd millennium BCE. The second episode of the epic is known as ‘The Forest Journey’ and is the story of deforestation in the Middle East2….”

“Now that we have explored the importance of wood and forests of antiquity, we make a big jump forward in time to examine the importance of wood in the rise of the West. Without the abundant availability of wood, Europe would never have been able to undertake the exploration of the world’s oceans that led to the great geographic discoveries. This development had become very difficult in the Middle East, where the ancient forests were had largely disappeared during antiquity.”


“...it has so far been mostly ignored by the greater scientific community…” Sound familiar? There are gargantuan forces at play transforming the ecosphere right in front of our eyes, and meanwhile, the greater scientific community, immersed in their meticulous research, is either preoccupied, or sanctimoniously in denial.
A perfect example are the three aforementioned US government publications. First up, the National Report on Sustainable Forests 2010. They are excerpted out of order, because the 2010 Report is based on the other two earlier drafts, but bear with me – we will discern some disturbing trends. Everything that follows will be direct quotes, that I won’t muddle up by including the extensive references to original research (which can of course be found by clicking the link) or adding quotation marks. Instead any comments of mine will be highlighted. Tommy Tidwell, the head of the USDA (which is the umbrella organization for the Forest Service), states in the introduction:

One of the report’s key findings is the fact that the United States is richly endowed with forests, 751 million acres to be exact. That area has remained remarkably stable over the last 50 years, and the amount of wood in these forests is increasing. Ha, does he mean the amount of living trees is increasing? Or the amount of dead wood is increasing?

At the same time, however, forests in the United States face a number of threats, ranging from fragmentation and loss of forest integrity due to development to an alarming increase in the area and severity of forest disturbances. The report finds, for example, that the incidence of insect-induced tree mortality has increased three-fold in the last decade. In the coming years, climate change could substantially increase the damages and uncertainties associated with these threats. Not coincidentally, forests have a major role to play in helping to mitigate climate change, a fact that is well documented in the report. Even he used that word “alarming”. That insect-induced tree mortality has “increased three-fold” is very important, especially considering (as should be kept in mind throughout) that this is all based on old data, and the trends are continuing and accelerating…Yet nowhere in this report is it mentioned that from controlled fumigation experiments it has repeatedly been demonstrated that plants and trees exposed to ozone are more likely to be attacked by insects, disease, and fungus cited as threats. Nowhere is there evident the plain speaking to be found in this textbook about European forests, which describes some stands as being “all but obliterated” by air pollution.

more information about the MPWG.
Right. No need to rush over to that link. Their latest news? Circa 2009. They did have a meeting in Canada last October…but Annex E and F (Summary, and Joint Draft Statement) are still “under preparation“. This is consistent with a disturbing lack of up-to-date information.

Right. Don’t rush over there either, because all it says is: Page Not Found.

Note: not even a glancing reference to acid rain, the Nitrogen Cascade, or ozone!

population growth—stresses on sustainability can be magnified. Policymakers concerned with sustainability should track trends in per-capita consumption and use available population projections to evaluate future prospects for sustainability. The MP C&I have indicators of per-capita consumption, but leave population projections to others. With one paragraph they dispense with arguably the greatest threat to forests of all. No surprise there.

species, or 27 percent of the total number of forest-associated species, are at risk of extinction. Horrible numbers…but if all the trees die from ozone, closer to 100 percent are at risk of extinction.

Do you suppose that’s why they leave out air pollution – because insects and fire are disturbances we cannot control. We CAN control air pollution of course. But we don’t want to.

p. I-17 Moreover, forests in close proximity to heavy emission areas, such as in and around cities, can help alleviate air pollution and reduce temperature variation by providing shade in the summer and shelter from wind in the winter. WHERE is the essential question – what happens to the forests when they “alleviate” air pollution; i.e. absorb it?? We know what happens when humans absorb it – they get cancer, emphysema, allergies, respiratory illness, heart disease, Alzheimer’s, ADHD, autism, and diabetes.

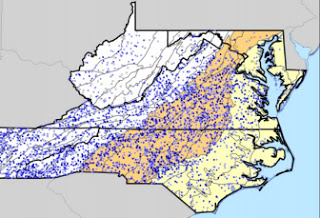
Wow, North Carolina recognized air pollution as a threat to forest ecosystems. Where is it in the synthesis? The report doesn’t even list ozone in their glossary, or nitrogen. Following is their one acknowledgment in the glossary:

transported, and deposited in human and natural ecosystems. Air pollutants may be absorbed by forest ecosystems without effects (sink) or exceed the absorption capacity and have a deleterious effect on processes or components. They manage to avoid any elaboration on exactly what those “deleterious effects on processes or components” might be. Purely Orwellian.

Following are excerpts from the Draft Forest Health Monitoring 2009 National Technical Report upon which the National Report was based. The FS has been monitoring forest health, by extensive and sophisticated means, utilizing ground inventories, aerial surveys and satellite imaging. This they do because there is a very large timber industry with vast amounts of money at stake. Think Georgia-Pacific, acquired by Koch Brothers in 2005 – a company which has paid tens of millions in fines for illegally polluting. Just a minor cost of doing business in the USA.
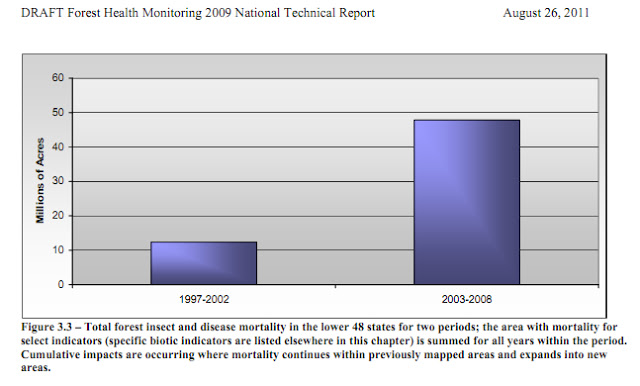
This chart measuring mortality only goes through 2008, which was the year I first noticed that every single tree had symptoms of decline. So had they included more recent data from the last three years, when symptoms have multiplied in number and severity, that mortality would have to be incredibly worse. Even so, this 2009 draft report has fairly extensive discussions about mortality and the link to pollution – a connection which was almost completely dropped from the next draft in 2010, as shall be seen – and the 2010 National Report from the USDA, which was quoted above. WHY??????
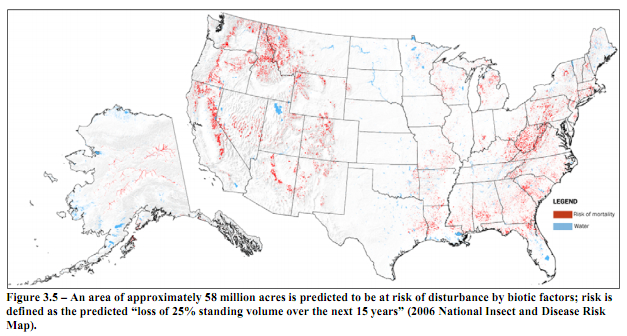 |
| p.32 58m. acres predicted loss of 25% standing volume over the next 15 years |

Right, “will not provide a sustainable forest”, because, all of the co-dependent interrelationships of various species that contribute to the complex web of life will have been irreversibly disrupted. This is evolution 101 and government agencies who skirt this fundamental aspect of genetic adaptation are doing so deliberately. You won’t see this come up again in the USDA final summation!


Intervention? That is delusional, but still, contrast the above assessment – total area with mortality and defoliation has quadrupled – with all the happy talk in the introduction of the National Report about our “remarkably stable” 751 million acres of forest. Below is a case study of Hawaii. I’m including it because it’s remarkable to see how comprehensive is the tragic end of paradise, where even the Forest Service uses a word like “decimating”.
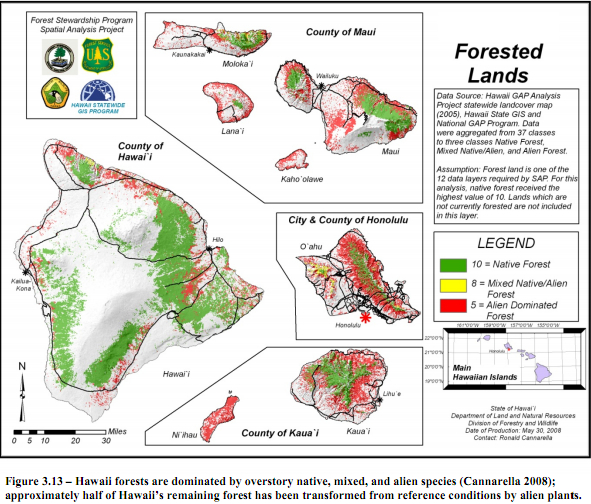
Hawaii is also negatively affected by invasive pathogen, plant and insect pests. Impacts of invasive species, including animals, have been profound in Hawaii and are at the root of Hawaii’s biodiversity crisis (fig. 3.13). Guava rust is currently defoliating non-native forests at low elevation; there is a potential threat to native ohia, which dominates 80 percent of Hawaii’s native forests. The erythrina gall wasp threatens widespread mortality of native wili trees, a component of much of Hawaii’s remaining dry forests, and has almost eliminated the introduced coral tree.

Non-native invasive plant species impacting ecosystems in Hawaii include strawberry guava, velvet tree, peacock plume, and hundreds of other plants; there are nearly as many naturalized alien plant species as native species. Hawaii is particularly vulnerable to invasive species because its native species evolved in the absence of ungulates, rodents and predators, which have since been introduced. Non-native mosquitoes carry avian malaria, decimating native birds. Invasive grasses provide fuel for fire.

p. 68: The approach to mortality presented here seeks to detect mortality patterns that might reflect subtle changes to fundamental ecosystem processes (due to such large-scale factors as air pollution, global climate change, or fire-regime change) that transcend individual tree species-pest/pathogen interactions. As far as I can tell, since this was written, the Forest Service has ceased to have interest in “detecting mortality patterns that reflect fundamental ecosystem processes due to such large-scale factors as air pollution”!

However, sometimes the proximate cause of mortality may be discernable. In such cases, the cause of mortality is reported, both because it is of interest in and of itself to many readers and because understanding such proximate causes of mortality might provide insight into whether the mortality is within the range of natural variation or reflects more fundamental changes to ecological processes.

At this point a mortality baseline is still being established for most of the U.S. To discern trends in mortality rates, at least three cycles of FIA data are required. With the up to two cycles of data currently available, it is only possible to do a spatial comparison of ecoregions and identify regions of higher than average mortality (relative to growth) for further study.

p. 102, Chapter 8
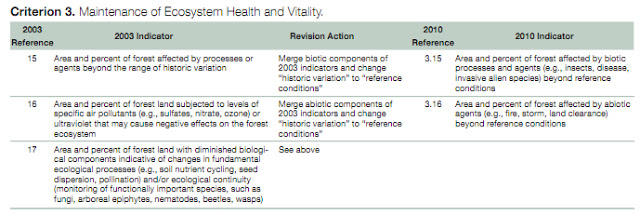
Criterion 3, Indicator 16 of the Montreal Process Criteria and Indicators for the Conservation and Sustainable Management of Temperate and Boreal Forests was designed to assess the impact of abiotic agents upon forests (Montréal Process Working Group 2007). Various abiotic agents, both natural and human-induced, can change forest structure and species composition. Where such change goes beyond some critical threshold, forest ecosystem health and vitality may be significantly altered and its ability to recover from disturbance reduced or lost, often meaning a reduction or loss of benefits associated with that forest ecosystem. Monitoring the area and percent of forests affected by abiotic agents beyond reference conditions may provide information needed in the formulation of management strategies to mitigate risk. The summary of this analysis is reported in the National Report on Sustainable Forests 2010 Report (Robertson and others 2010) while the purpose of this document is to provide the detailed evidence to support the reported data. “The summary of this analysis is reported in the National Report on Sustainable Forests 2010 Report”…oh, really??

Objectives and Methods
The original National Report on Sustainable Forests 2003 (Guldin and others 2004) and the Montréal Process Working Group (2007) identified several abiotic agents: fire, storm, land clearance, permanent flooding, salinization, specific air pollutants (e.g. sulfates, nitrate, ozone), ultraviolet B, and soil nutrient cycling. These were addressed in three separate indicators. In the National Report on Sustainable Forests 2010, these were re-organized and addressed as one indicator (Criterion 3, Indicator 16) and were grouped into five sub-indicators that have the greatest impact on forest health. These abiotic sub-indicators are: fire, weather-related damage, pollution, land use, and climate. Specific air pollutants – nitrate, ozone…where is that again in the National Report?? here it comes, watch for the sleight of hand on p. II-45:

What has changed since 2003?
The data––The indicators in this criterion have benefited from data improvements resulting from ongoing survey efforts undertaken by the Forest Service’s Forest Health Protection program.
The indicator––The following table summarizes the revisions. Indicator reference numbers for 2003 and 2010 are provided to assist in comparisons with the previous report. A more detailed rationale for the revisions may be found at http://www.rinya.maff.go.jp/mpci/meetings/18_e.htm.
Note: Below is a portion of where that link with the “more detailed rationale for revisions” leads – it’s all in Japanese with the exception of the copyright line, and when you try to translate, it responds with an error message:

Following is the only other sections that reference pollution I could find in the National Report, which is buried by the volume of references to fire, weather, insects and disease – and then dismissed:
What does the indicator show?
Of the abiotic agents that affect forested ecosystems, five were selected that have a dominant impact—fire, weather, pollution, land development, and climate change. Given the breadth of disturbance agents, it was not possible to treat any one of them in detail. Extended details are available in the supporting data report.

Pollution effects on forests are indicated by Critical Acid Loading (CAL), which incorporates SO4 and NO3 and their relationship with soil properties. From 1994 to 2000, 74 million acres, or 17 percent of U.S. forest soils exceeded their CAL by more than 98.4 equivalents per acre per year. These areas are predominately located in the Northeastern United States. Surface ozone (O3) is also an important air pollutant that affects vegetation. No evidence exists linking Forest Health Monitoring ozone bioindicator response data to a specific tree health problem or regional decline. Nevertheless, mapped data demonstrate that concentrations of plant damaging ozone air pollution are widespread in parts of the United States.
That’s it, folks! Is that any way to report on the Nitrogen Cascade, which leads to eutrophication??

The 2009 Draft has more about pollution that was subsequently forgotten in 2010:
Pollution
The Forest Health Monitoring ozone (O3) biomonitoring program uses ozone-sensitive plants to monitor air quality and the potential impacts of tropospheric O3 (smog) on forestlands. These data include both tabular regional synopses and a raster surface model using the biomonitoring site point data. The surface ozone-injured indicator plants regional summary and graph were obtained from Smith (2008).
A Critical Acid Loading (CAL) surface raster model obtained from McNulty (2007) and the forest mask were applied to create a CAL grid layer for forested areas. The data were summarized and graphed.

p. 105 Pollution
Surface ozone (O3) is an important air pollutant that affects vegetation (US EPA 1996). Ozone is routinely monitored throughout the world and data are mostly recorded as hourly or half-hourly averages. Over the last 30 years, hourly averaged data have been summarized in different ways for the purpose of assessing vegetation effects.

The development of exposure indices to characterize plant exposure and to quantify the relationship between O3 exposure and ensuing plant response has been, and continues to be, a challenge. The USDA Forest Health Monitoring program utilizes ozone-sensitive plants (bio-indicators) to assess O3 impact upon forest ecosystems. There is not yet any evidence linking Forest Health Monitoring ozone bioindicator response data to a specific tree health problems or regional declines. Nevertheless, the mapped data demonstrate that plant damaging concentrations of ozone air pollution are widespread in parts of the nation.
There is “not yet any evidence linking…ozone…to a specific tree health problems or regional declines?? They have got to be kidding. How about all the trees that are dying from no other apparent cause?

Continued monitoring and analysis will be important when determining probable or significant ozone damage. Ozone damage is far greater in the northeastern states however the 5-year trend indicates a decline in damage, while the west coast states have experienced an increase in ozone damage (fig. 8.4).
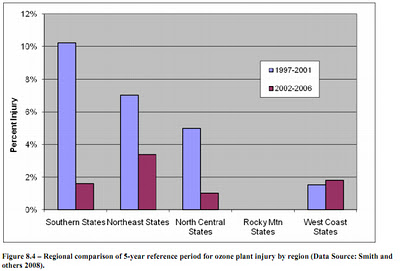
Just TRY to get more recent biomonitoring data – this chart stops at 2006! When I called the northeastern station this year, I was told they had stopped collecting due to “anticipated budget constraints” and when I asked what they were doing with their time (they are still being paid!) I was laughingly told they are pushing a lot of paper around their desks.

p. 109: Concern regarding the impacts of continued nitrogen and sulfur deposition on ecosystem health has prompted the development of critical acid load (CAL) assessments for forest soils. A critical acid load is a quantitative estimate of exposure to one or more pollutants at or above which harmful acidification-related effects on sensitive elements of the environment occur. A pollutant load in excess of a critical acid load is termed exceedance. Simple mass balance equations (SMBEs) were used to estimate forest soil critical acid loads for the conterminous United States. This spatial data was acquired and masked by the forest mask and summarized. From 1994-2000, 74.2 million acres or 17 percent of the soils on forest land exceeded their CAL threshold by more than 101 equivalents per acre per year. These areas include much of New England and West Virginia with very few areas of exceedance predicted in the western United States.
I believe the emphasis on soils is a distraction. Certainly acid rain depletes soils of nutrients and that has killed many trees, BUT, plants and trees being grown in pots with enriched soils (and being watered) have no more or less symptoms of ozone injury than plants or trees growing in the ground. The only thing they share in common is the atmosphere.

When Charles Little wrote “The Dying of the Trees” (for which he was widely ridiculed ostracized) one of his important examples was the disappearance of dogwoods on the Eastern Seaboard. Dogwoods once made up a significant portion of the understory of the woods. Thirty years ago, when I hunted for morels in spring, the dazzling white dogwood bracts made what looked like a gorgeous blizzard of snow, suspended in the greening woods. It was breathtakingly charming, the kind of sight that fills you with happiness and sheer delight just to be alive. Let’s see what the Forest Service has to say about the condition of dogwoods now:
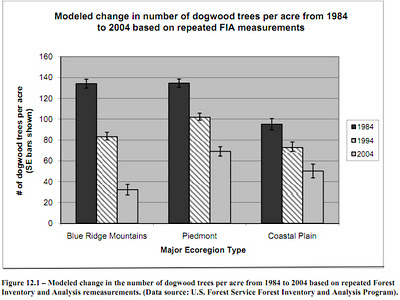
p. 144: Results – Approximately 80 percent of dead trees had confirmed D. destructiva infections. As of 2006, 245 of the 294 (85 percent) flowering dogwoods in the permanent plots had died. Of the dead trees 67 percent (196 trees) died after being confirmed as positive for infection. However, of the 43 trees still alive as of 2006, 79 percent had also been confirmed as positively infected by anthracnose. Since 2000, mean crown rating for living trees has remained relatively constant. Prior to 2000 mean crown rating had declined steadily from a high of 5.0 in 1989 to a low of 2.3 in 2002. As of 2000, no trees were rated “healthy,” or a crown rating equal to five. Of surviving trees, those infected during the secondary peak infection year of 1999 were in the poorest health.
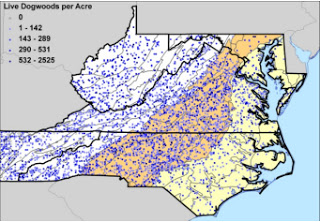
Notice, NONE of the trees were rated as healthy, even though not all of them had anthracnose. Above graph, live dogwoods per acre in 1983-1985, below, 2000-2004.


The Draft 2010 has already abandoned any specific mention of ozone.
p. vii Executive Summary:
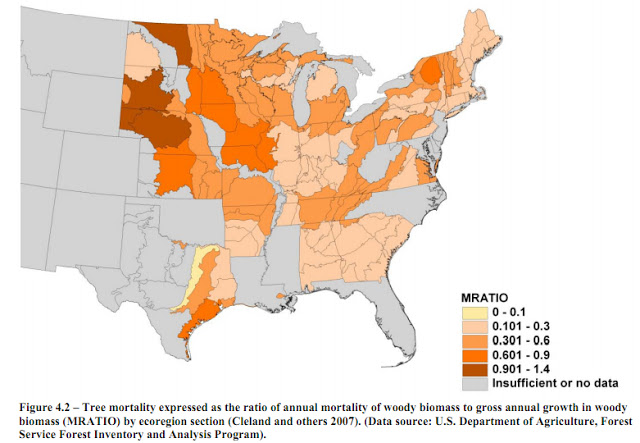
Mortality is a natural process in all forested ecosystems, but high levels of mortality at large scales may indicate that the health of forests is declining…An analysis of FIA plots from 27 states found that the highest ratios of annual mortality to gross growth occurred in ecoregion sections of the Plains States. Mortality was also high in parts of southeastern Texas and New York. Even in areas of relatively high mortality relative to growth, no mortality occurred on most sample plots. However, on the plots with mortality, larger-diameter trees exhibited higher mortality trends as compared to remaining smaller-diameter classes of surviving trees, suggesting the mortality is related to either senescence of older stands or some insect or disease issue.
Or else it’s suggesting mortality of older trees is because they have been exposed to toxic pollution longer! Senescence is just a lie, most trees can live for centuries. This article lists 10 famous ancient trees, the oldest of which is 4,800 years old, located in Nevada! And again, rigorous scientific studies show that trees stressed by pollution are more likely to be attacked by and succumb to insects and disease.

Results indicate that there are more than 10 billion standing dead trees in forests across the United States, most of them less than 30 cm in diameter. Forests in the Rocky Mountains and Pacific Northwest have some of the largest mean biomass of standing dead trees per unit of forest land, while Plains states had the least. More than 130 species have greater than 1 million Mg of standing dead biomass nationwide. Given the emerging role of standing dead trees in biomass/bioenergy economies and carbon cycling, continued monitoring of this resource is highly warranted.

The first paragraph of the introduction, with its “long list of threats” doesn’t mention pollution either:
Forests cover a vast area of the United States, 303.1 million hectares (749 million acres) or approximately one-third of the nation’s land area (Smith and others 2004). These forests possess substantial ecological and socioeconomic importance. Both their ecological integrity and their continued capacity to provide goods and services are of concern in the face of a long list of threats, including insect and disease infestation, fragmentation, catastrophic fire, invasive species, and the effects of climate change.

Chapter 4, tree mortality:
The mission of FHM is to monitor, assess, and report on the status, changes, and long-term trends in forest ecosystem health in the U.S. (U.S. Dept. of Agriculture, Forest Health Monitoring 1994). Thus, the aim of this mortality analysis contrasts with how mortality might be approached in other reports, such as FIA State reports or State Forest Health Highlights. The approach to mortality presented here seeks to detect non-specific or multiple host mortality patterns that might reflect subtle changes to fundamental ecosystem processes (due to such large-scale factors as air pollution, global climate change, or fire-regime change) that transcend individual tree species pest/pathogen interactions or direct concern over forest resource production and availability.

At this point a mortality baseline is still being established for most of the U.S. using the first two cycles of annualized data (i.e., the first two measurements of each plot). To discern trends in mortality rates, a minimum of three cycles of FIA data are required*6. With at most two cycles of data currently available, it is only possible to do a spatial comparison of ecoregions and identify regions of higher than average mortality (relative to growth) for
further study.
Always, further study. Wait, why can’t they present a trend in mortality that might “reflect subtle changes to fundamental ecosystem processes – due to such large-scale factors as air pollution??? Oh, they “choose not to do so”:

*6 In theory, one could estimate changes or trends in mortality rates using just two cycles of data by comparing, for example, plots measured in 2000 and 2005 with those measured in 2001 and 2006, those measured in 2002 and 2007, etc. However, we choose not to do so because estimating mortality rates independently for each panel of data reduces the effective sample intensity by a factor of five and because an analysis of mortality rates using heavily overlapping time periods will be unlikely to detect subtle changes in mortality rates.

p. 31 Methods
The MRATIO can be large if an over-mature forest is senescing and losing a cohort of older trees. If forests are not naturally senescing, a high MRATIO (> 0.6) may indicate high mortality due to some acute cause (insects or pathogens) or due to generally deteriorating forest health conditions. An MRATIO value greater than 1 indicates that mortality exceeds growth and live standing biomass is actually decreasing.
This is frightening because it is so out of date considering the dramatic and rapid deterioration of tree health since 2008:
On Page 35 is a chart broken down into which species are dying. p. 36 says:
Green ash also represented a large portion of the mortality in ecoregions 332A-Northeastern Glaciated Great Plains (17.43 percent), 332C-Nebraska Sand Hills (10.22 percent), and 332E-South Central Great Plains (12.25 percent). The cause of this mortality is not immediately apparent. One might be tempted to suspect the invasive insect, the emerald ash borer. However, this pest has not yet been reported in or near these regions (USDA Forest Service and others, N.d.). In ecoregion 332A-Northeastern Glaciated Great Plains, the age of the dead trees (table 4.2) suggests that older, senescent stands may be dying.
I love it! They are “tempted” to blame an insect that doesn’t exist!! So again it’s older, senescent stands, since they can’t find a biotic agent. The fact is that aside from a few isolated, protected specimens located in places that have been preserved for historical or cultural reasons – like churcheyards, battlefields, Colonial estates, and Ivy-league campuses – there are virtually NO senescent stands in the Eastern US, they have ALL been clearcut, some more than once (unfortunately). The new growth is too young to be dying of natural causes.

The mortality pattern shown in these analyses does not immediately suggest large-scale forest health issues. Mortality is rather low in most of the areas for which data are available. The areas of highest mortality occur in the mostly riparian forests of several plains ecoregions. The causes of the mortality of several of the tree species experiencing high mortality in these regions (including eastern cottonwood in ecoregion 332C-Nebraska Sand Hills and balsam poplar in ecoregion 332A-Northeastern Glaciated Great Plains) are not immediately apparent. Further study of the health of these forests is probably warranted.
Further study is “probably warranted?” I should think so since the causes of trees experiencing high mortality “are not immediately apparent” which is probably because they refuse to factor in the rising level of background ozone, or the disruption to the nitrogen cycle. It’s interesting that “The areas of highest mortality occur in the mostly riparian forests…” What is riparian?? Let’s check with our trusty Wikipedia:

“Wiki: The word “riparian” is derived from Latin ripa, meaning river bank. The riparian is an important feature of a wetland because it allows characterization of the wetland’s overall health…Research shows riparian zones are instrumental in water quality improvement for both surface runoff and water flowing into streams through subsurface or groundwater flow. Particularly the attenuation of nitrate or denitrification of the nitrates from fertilizer in this buffer zone is important. Riparian zones can play a role in lowering nitrate contamination in surface runoff from agricultural fields, which runoff would otherwise damage ecosystems and human health. The use of wetland riparian zones shows a particularly high rate of removal of nitrate entering a stream and thus has a place in agricultural management.”
As usual, the emphasis is on the benefit received by having trees in riparian areas soak up nitrate contamination – and not on what happens to trees when they absorb it. Is is any wonder that these areas have the highest mortality rate? They are getting a double whammy from absorbing ozone in their foliage and nitrates from their roots.

Introduction to Chapter 8 p. 71
Airborne nitrogen (N) and sulfur (S) from industrial pollution and automobile exhausts have been deposited across Europe and the Northeastern US for over 70 years in the form of acid rain. Heavily polluted areas can receive over 50 kg N ha-1each year. The environmental impacts of air pollutants have been studied since N and S were first suspected to cause forest damage and decline across the region in the mid-1980s. High pollutant levels and forest mortality can lead to mobilization of soil aluminum (Al3+) and nitrate (NO3-) and subsequent increases in stream Al and NO3 concentrations. Increased Al and NO3 stream concentrations can have negative health impacts on fish populations and human water supplies. High forest soil acidity can also cause aluminum toxicity in roots, foliar nutrient imbalances, reduced tree cold tolerance, and tree freezing injury. Each of these stressors can lead to tree mortality.
“Each of these stressors can lead to tree mortality” – (never mind what they do together) and yet the National Report neglects to mention any single one of them as a cause of tree mortality??

…Acidic deposition in excess of the critical acid load is termed the acidic exceedance, and the larger the acidic exceedance, the greater the risk of ecosystem damage. This definition of critical acid load applies to a single, long-term pollutant exposure. However, a static critical acid load level may not accurately assess ecosystem risk to damage when an ecosystem is subjected to multiple, episodic environmental stresses. If multiple stress impacts (e.g., drought, insects, wildfire) are included in critical acid load assessments, the critical acid load may need to be lowered in many areas to maintain long-term ecosystem health.

Climate Change Impacts on Critical Acid Loads
Climate change is a generic term used to define a host of changing environmental conditions associated with the atmospheric increase of greenhouse gases and global warming. Climate change is characterized by both climatic shifts and increased climate variability. Both inter-decadal shifts in climate and inter-annual climate variability can influence the critical acid load of forest soils. Each of these impacts is examined below.
Short- and Long-Term Droughts
Water is one of the principle determinants of ecosystem type. Average annual precipitation in temperate forests ranges from 50 to 250 cm per year. Deserts, scrubland, and woodlands receive between 0 and 125 cm of precipitation per year. Millennia of plant competition have favored vegetative species that best adapt to limited resources (including water). Short-term (i.e., less than two years) drought can reduce ecosystem productivity, leaf longevity in deciduous species, and leaf area. These factors reduce biological demand for nitrogen which can alter soil critical acid loads. Under short-term (i.e., less than two years) extreme drought, reduced soil moisture can cause reduced nitrogen mineralization and nitrification that then result in reduced ammonium and nitrate availability. These conditions would not impact critical acid load in the short term if both nitrogen demand and supply are reduced. However,
nitrogen will continue to accumulate in the ecosystem during the drought. A nitrate pulse could occur following a drought if nitrogen mineralization and nitrification rates respond to available water before plant demand for nitrogen increases.
Long-term (i.e., greater than two years) droughts can cause additional ecosystem disruptions and therefore have the potential to significantly lower forest soil critical acid load levels. Long-term droughts have all of the characteristics of short-term drought plus the potential for tree mortality due to water stress, increased insect outbreak potential, and increased fire risk. As with short-term drought, long-term drought may reduce biological nitrogen demand and supply. Additionally, the potential for terrestrial vegetation mortality could lead to a significant decrease in biological nitrogen uptake. If tree mortality is severe, a large nitrate pulse could occur following the drought, similar to the nitrate pulse observed following forest harvesting.
A large nitrate pulse?? This looks intriguing. It also looks like a positive amplifying feedback – trees die back (or are cut), meaning they take up less nitrogen, so there is even more nitrogen supplied to the remaining trees, overfertilizing them.

Conclusions
Climate change is expected to negatively impact forest ecosystems in several ways during this century. However, the exacerbation of forest soils affected by acidic deposition may not be among those negative impacts. The results of this SMBE suggest that those soils most likely to be in exceedance of their critical acid load levels (e.g., New England forests) may also be the most likely to benefit from the warming associated with climate change. Increases in both nitrogen uptake and base cation weathering are predicted in this region of the country. The increase in weathering rates would be particularly important for increasing the region’s critical acid load capacity. This study suggests that a major reduction in the area representing the most seriously impacted forest soils could occur. While this is potentially good news for ecosystem management, other aspects of climate change are not accounted for by the simple mass balance equation approach to critical acid load determination. Potential increases
in insect outbreaks, hurricane intensity, wildfires, and changing patterns of ice storms could all reduce forest productivity and therefore nitrogen uptake. These conditions would the reduce buffering capacity of the ecosystem and make it more likely that the ecosystem would be in exceedance of its critical acid load, so caution should be used when interpreting these results.
I’m sorry, but if you parse it, this incoherent, self-contradictory paragraph reads like double-speak! Increasing the critical load capacity?? This is so out of step with current science about disruption of the nitrogen cycle, it’s just staggeringly ignorant.

p. 106
Given the ecological importance of whitebark pine as a keystone species in these ecosystems, it is imperative that genetic materials, such as seed and/or scion, are collected from these populations and placed in genetic archives for their potential use in ecosystem restoration in the future. Furthermore, the populations should be monitored regularly to determine the trajectories of their health status over time and action taken as appropriate. All options intended to reverse the decline of these populations should be considered, including the dissemination of genetically resistant materials, restoration of natural fire regimes, and maintaining and archiving the gene pools of current populations.
This prognosis is stunningly bleak. Whitebark pine – a keystone species – is in such imminent danger of extinction that they want to collect and archive genetic materials? Sadly, I think this is true for ALL species if we keep on filling the atmosphere with poisonous gases. Next, check out the graph of the increase in wildfire incidents and keep in mind, it only goes to 2009. Wait till the wildfires start tearing through the suburbs, lapping at the fringes of major cities. It’s coming.
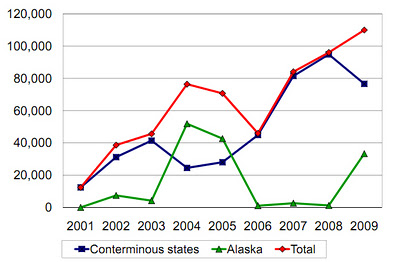 |
| Forest Fire Occurrences measure by MODIS |
The primary keeper of the ozone monitoring data used in these reports (or not, as it appears to have been jettisoned after 2009) is Gretchen Smith, whose most recent publication, “Ambient Ozone Injury to Forest Plants in Northeast and North Central USA: 16 years of biomonitoring” is from July 2011″. Here’s the Abstract, a self-immolation that explains why the FS feels justified in ignoring ozone:
“The US Forest Service administers a long-term, nationwide ozone biomonitoring program in partnership with other state and federal agencies to address national concerns about ozone impacts on forest health. Biomonitoring surveys begun in 1994 in the East and 1998 in the West provide important regional information on ozone air quality and a field-based record of ozone injury unavailable from any other data source. Surveys in the Northeast and North Central subregions cover 450 field sites in 24 states where ozone-sensitive plants are evaluated for ozone-induced foliar injury every year. Sites are typically large, undisturbed openings (>3 acres in size) close to forested areas where >3 bioindicator species are available for evaluation.

Over the 16-year sampling period, injury indices have fluctuated annually in response to seasonal ozone concentrations and site moisture conditions. Sites with and without injury occur at all ozone exposures but when ambient concentrations are relatively low, the percentage of uninjured sites is much greater than the percentage of injured sites; and regardless of ozone exposure, when drought conditions prevail, the percentage of uninjured sites is much greater than the percentage of injured sites. Results indicate a declining trend in foliar injury especially after 2002 when peak ozone concentrations declined across the entire region.“
Below is a random picture I took in July of 2009 of maple leaves with marginal leaf burn. This is utterly typical of trees the past three summers – and the biomonitoring program supposedly reveals a declining trend in foliar injury?? I. Don’t. Think. So.
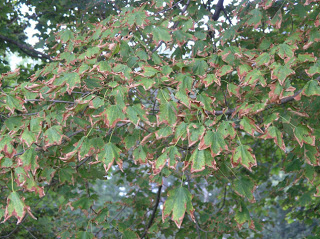
Notice, the abstract states that PEAK ozone concentrations declined…but neglects to mention that the background levels are inexorably increasing. Personally, I think it’s not just possible but likely that it is worse – perhaps far, far worse – for plants to absorb ozone lower but constant levels of ozone all of the time without respite – including nighttime – than to be exposed to occasional transient high doses during daylight when there is UV radiation – because they never get a change to recover. I called Smith a couple of years ago to ask her whether she wasn’t alarmed at what the data showed, and perhaps ought to communicate that alarm to public policy makers. She seemed to get rather irritated and responded that partly due to her work in the ozone biomonitoring program, the EPA was going to tighten ozone standards. Well, we know how well that worked out!

Source:
