| Online: | |
| Visits: | |
| Stories: |

| Story Views | |
| Now: | |
| Last Hour: | |
| Last 24 Hours: | |
| Total: | |
Graph of the Day: Carbon emissions and human population, 1751-2013
13 June 2015 (Desdemona Despair) – Data show that growth of human carbon emissions in the modern era is pretty close to exponential (cf. “Graph of the Day: Global carbon emissions from fossil fuels, 1751-2013”).
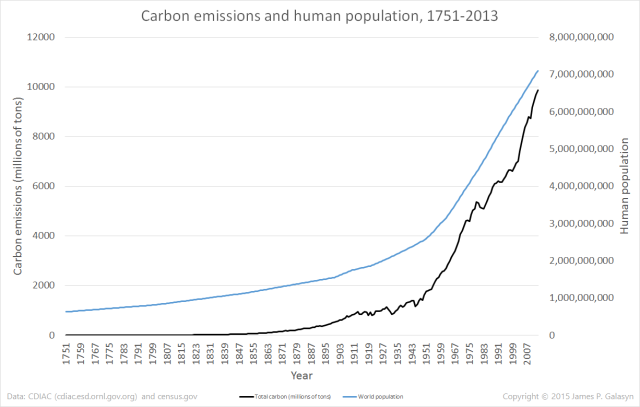
But what about carbon emissions per person? The Carbon Dioxide Information Analysis Center (CDIAC) maintains a database of fossil-fuel CO2 emissions, and the U.S. Census Bureau keeps track of world population. Here are the two data sets plotted together (click for larger version):
Population for the years before 1950 are linearly interpolated – see the spreadsheet, Global CO2 Emissions 1751-2010 CDIAC.xlsx, for details.
With these data sets, it’s easy to compute the average amount of carbon emitted per person per year.
The per-capita graph brings out some interesting details.
Per-capita carbon emissions increase at a supralinear rate
Excel’s default polynomial curve fit shows quadratic growth, with an R2 value of 0.977. This curve fit probably isn’t physically meaningful, but it might be useful for extrapolation.
Carbon emitted per capita surpassed 1 ton per person in 1968 and has never fallen below this value since then. Extrapolating the quadratic curve, emissions per capita will surpass 2 tons per person around the year 2050.
The growth curve breaks for only two time periods
Human carbon emissions increase relentlessly over modern history, except for two sharply defined periods: 1914-1945 and 1973-1999.
The first period of flat growth is clearly related to the global disruption of trade and industry caused by World War 1, the Great Depression, and World War 2.
The second period of flat growth clearly begins with the 1973 oil shock caused by the OPEC oil embargo. Its end is less clear, starting in 1999 and returning to strong growth in 2002. Two candidate events for the return of growth are the establishment of the euro in 1999, and the signing of the Strategic Offensive Reductions Treaty by Russia and the U.S. in 2002. If you have ideas of what happened in this period to return to the “natural” growth rate, please tell us in comments.
The Great Recession of 2007-2009 barely shows up, as a small dip.
The “natural” growth rate of per-capita emissions is exponential
Removing the two periods of flat growth, the “natural” rate of emissions growth is very nearly exponential, with an R2 value of 0.975 for the default Excel curve fit.
This analysis suggests an interesting conclusion: as human population grows, it emits carbon at an exponentially greater rate. Only two periods in modern history have broken this rule, both characterized by abrupt, global, economic dislocations. As soon as the conditions that caused the dislocations are resolved, exponential growth returns immediately.
If humans are to avoid catastrophic climate change, it’s critical that we deflect this curve downward from its inexorable climb. Knowing that the only two interruptions in the growth of carbon emissions happened during periods of global economic distress, we get an idea of the scale of change that’s needed to save the planet.
You can get the data and related graphs here: Global CO2 Emissions 1751-2010 CDIAC.xlsx.
Source: http://www.desdemonadespair.net/2015/06/graph-of-day-carbon-emissions-and-human.html


