


| Story Views | |
| Now: | |
| Last Hour: | |
| Last 24 Hours: | |
| Total: | |
SIF Portfolio March Review: Hamp;amp;T, Plus500 and Avesco

This week’s review contains an interesting twist: two of the three stocks which should be up for review this month have already left the SIF Portfolio.
In one case, I had no choice. Avesco was bought out at a handsome premium, leaving the portfolio with a tasty profit. But was my decision to sell Plus500 immediately after the FCA’s planned spread betting crackdown was announced a mistake? In this article I’ll run the numbers and find out what might have been.
The third stock under review this week is pawnbroking and personal loan group Hamp;T. This firm recently published a strong set of 2016 figure. Small cap analyst Graham Neary said he was “pretty happy with the results”, but Hamp;T’s position in the portfolio is now uncertain. Find out why below.
Avesco
This small-cap audio-visual services firm was taken over with a 650p per share cash bid in November. This left the portfolio with a 132% profit on a 280p buy price after just two months. I suspect that’s a record which will stand for some time…
In my view, there are two lessons to take away from this success. The first is that it doesn’t pay to focus too heavily on historic price action. Avesco’s share price had risen from 128p to 293p during the eighteen months before I added it to the portfolio. Despite this, the stock was still cheap enough to offer compelling value and attract a buyer.
The second lesson is that if you protect the downside, the upside should take care of itself. When Avesco joined the portfolio, it had an underlying P/E of 15.2, a price/free cash flow ratio of 6.9 and an earnings yield of 11.6%.
This profitable and cash generative stock was backed by net assets of 230p per share. Net debt was minimal and Avesco had a Piotroski fundamental health score (F-Score) of eight out of a possible nine.
Barring a run of very bad luck, shareholders’ cash ought to have been safe, even if a bid hadn’t come along.
Verdict: Taken over
Total return: +132%
Plus500
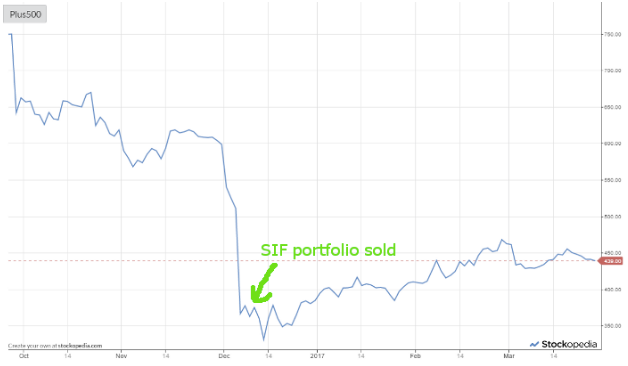
Plus500 stock fell by 30% at the start of December, after the FCA announced plans to restrict the leverage available to retail spread betting and CFD customers. As Plus500 is widely seen as being heavily dependent on inexperienced retail punters, investors marked down the stock sharply.
I decided to sell Plus500 from the portfolio immediately, crystallizing a 50% loss. My decision was made on the basis that “the investment story has changed and there’s no way to know how things will pan out”. I’d maintain that view today. But the new FCA regulations are still under consideration and aren’t yet affecting the firm’s trading or growth.
In the short term at least, I didn’t make enough allowance for Plus500’s strong trading and incredible cash generation. The firm’s total dividend for 2016, including special dividends, was 88.5 cents per share. This gives a trailing yield of about 16%.
Current forecasts suggest a payout of 46 cents per share this year, giving a forecast yield of 8.5%. Investors have been unable to resist such high yields and have bought back into the stock. Plus500 now trades at about 438p, up by 31% from the low of 332p seen early in December.
Like many knee-jerk reactions, my decision to sell may have been wrong. If I’m honest, I’m not too concerned by this. I continue to believe that there’s something that’s just too good to be true about this business. But if I’d obeyed my own rules, the portfolio would be considerably better off:
| When sold on 7 Dec ‘16 | If I’d held until 27 March ‘17 | |
| Portfolio loss | £26,065.82 | £17,369.56 |
| Total return (inc dividends) | -48.2% | -35.0% |
Verdict: The cost of selling early was an extra 13% loss.
Hamp;T
Pawnbroker and personal loan group Hamp;T has risen steadily since joining the SIF Portfolio in September.
However, the firm’s recent results have pushed the stock out of the SIF Screen, forcing me to sell Hamp;T following this review. Given that the results were pretty decent on all counts, I think it’s worth asking why Hamp;T no longer qualifies for my screen. Does it fail on value, quality or momentum criteria?
Using the excellent Checklist tool, I can see that there are two reasons for Hamp;T’s exit:
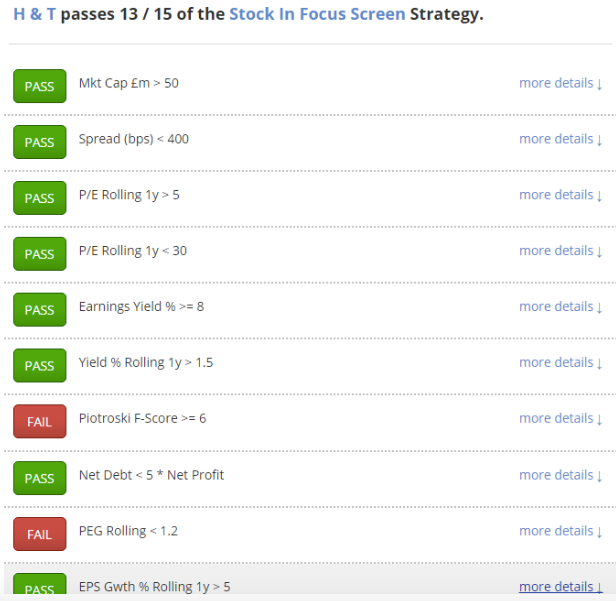
Piotroski F-Score: This nine-point checklist provides a useful snapshot of a company’s financial health, cash generation and profitability. The minimum score required for my screen is six, but since issuing its results, Hamp;T’s score has dropped to five:
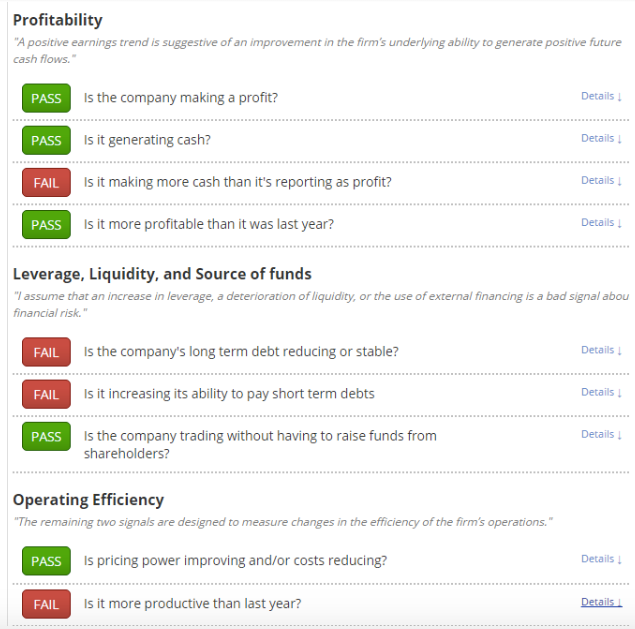
The lower three ‘fails’ are not a serious concern, in my view. They’re either marginal or else show ratios that are still at very comfortable levels. For example, HAT’s current ratio fell from 14 to nine last year. That’s hardly a major worry.
What is worth noting is that the group sunk most of its cash flow into expansion in 2016. This is reflected in the fail for “is it making more cash than it’s reporting as profit?”.
Hamp;T’s inventories rose by £5m last year, while receivables rose by £8.1m. This reflects store estate growth and the expansion of the group’s loan book. These will probably be profitable investments. But for now, this expansion means that last year’s dividend wasn’t covered by free cash flow. Net debt had to rise slightly to meet the shortfall.
PEG Ratio: Hamp;T’s earnings per share growth is expected to be lower this year than in 2016. This, combined with a higher share price, has pushed up the stock’s rolling PEG ratio above my screen threshold of 1.2, albeit only by a tiny amount:
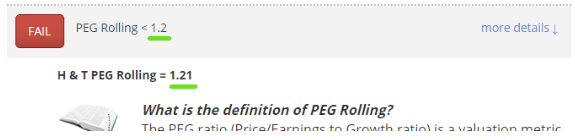
This is one of the hazards of a screen-based approached to stock selection. This ‘fail’ is not really anything more than a rounding error, and could easily reverse if Hamp;T’s share price falls by a few pence.
That’s why I believe that if you buy and sell stocks based on a screen, it’s worth checking the actual numbers behind the screen pass/fail scores before making any trades.
Rising StockRank
My screening criteria tend to select stocks with high StockRank. But as with Coats Group last week, this relationship isn’t fixed.
Hamp;T’s StockRank was 90 in February, before the firm published its 2016 results. It’s now risen to 95, suggesting the stock is a better buy following these figures. I wouldn’t disagree too much with this assessment, but I’m going to sell Hamp;T from the portfolio this week all the same.
Verdict: Sell
Total return: +12%
As always, these comments only reflect my opinion. Please do your own research before buying or selling any stock and feel free to share your views in the comments below.
Source: http://www.stockopedia.com/content/sif-portfolio-march-review-hampt-plus500-and-avesco-178224/
