| Online: | |
| Visits: | |
| Stories: |

| Story Views | |
| Now: | |
| Last Hour: | |
| Last 24 Hours: | |
| Total: | |
Commodity Prices Set To Plunge Below 2008 Lows
Market Oracle
By: Austin_Galt
 This analysis will cover the CRB Continuous Commodity Index, the US Dollar index and one of the main commodity currencies, the Australian dollar.
We’ll begin with the CRB Continuous Commodity Index which comprises a mixture of components from sectors including energy, metals, soft commodities and agriculture.
Let’s take a top down approach to the analysis beginning with the yearly chart.
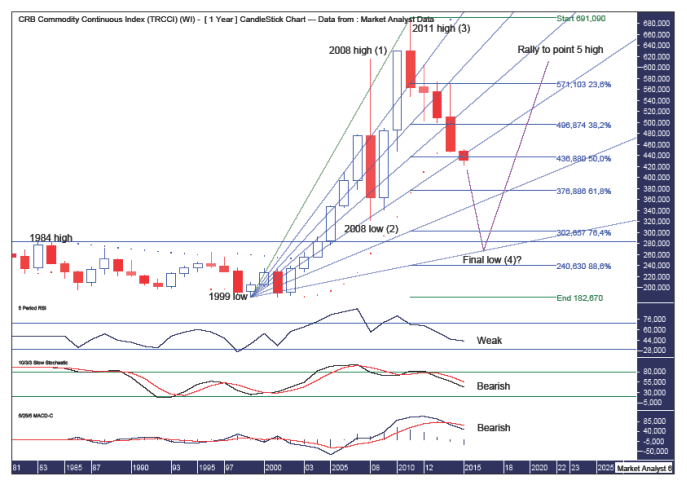
CRB YEARLY CHART

The lower indicators, being the Relative Strength Indicator (RSI), Stochastic and Moving Average Convergence Divergence (MACD), are all trending down and looking bearish. There is certainly nothing to get excited about from a bullish point of view.
The Parabolic Stop and Reverse (PSAR) indicator has a bearish bias after price busted the dots on the downside last year.
To my eye, there looks to be a massive 5 point broadening top in play with the 2008 high point 1, the 2008 low point 2 and the 2011 high point 3. I believe price is now on its way to a point 4 low. This may take another two to three years to play out. And once the point 4 low is in place I expect a massive inflationary move to new all time highs as price searches for a point 5 high.
So where is the point 4 low likely to be?
I have added Fibonacci retracement levels of the move up from the 1999 low at 182 to the 2011 high at 691. I expect a move down, at the minimum, to the 76.4% level at 302 and, at the maximum, to the 88.6% level at 240. I favour somewhere in between.
I have added a Fibonacci Fan from the 1999 low to 2011 high. Looking retroactively, there is some nice price symmetry with the 2008 and 2009 lows finding support at the 50% angle. Also, the 2012 top was at resistance from the 23.6% angle while the 2014 top was at resistance from the 38.2% angle. Price is now milling around the 61.8% angle and I expect some support to come in shortly that gives rise to a rally.
However, given the bearish indications already outlined, I am looking for the downtrend to eventually bottom out around the 88.6% level which looks to be between the 76.4% and 88.6% Fibonacci retracement levels already outlined.
Also, I have drawn a horizontal line denoting the 1984 high at 284. Old tops often provide support in the future and that is my expectation here. I often find price dips a bit below previous tops as a way to really test that support and I think price can nudge a bit below this level.
Let’s move on to the monthly chart


